The live Aether dashboard — the three-event globe and inspector

Index / Present / P-02 / Active

Aether Planetary Engine

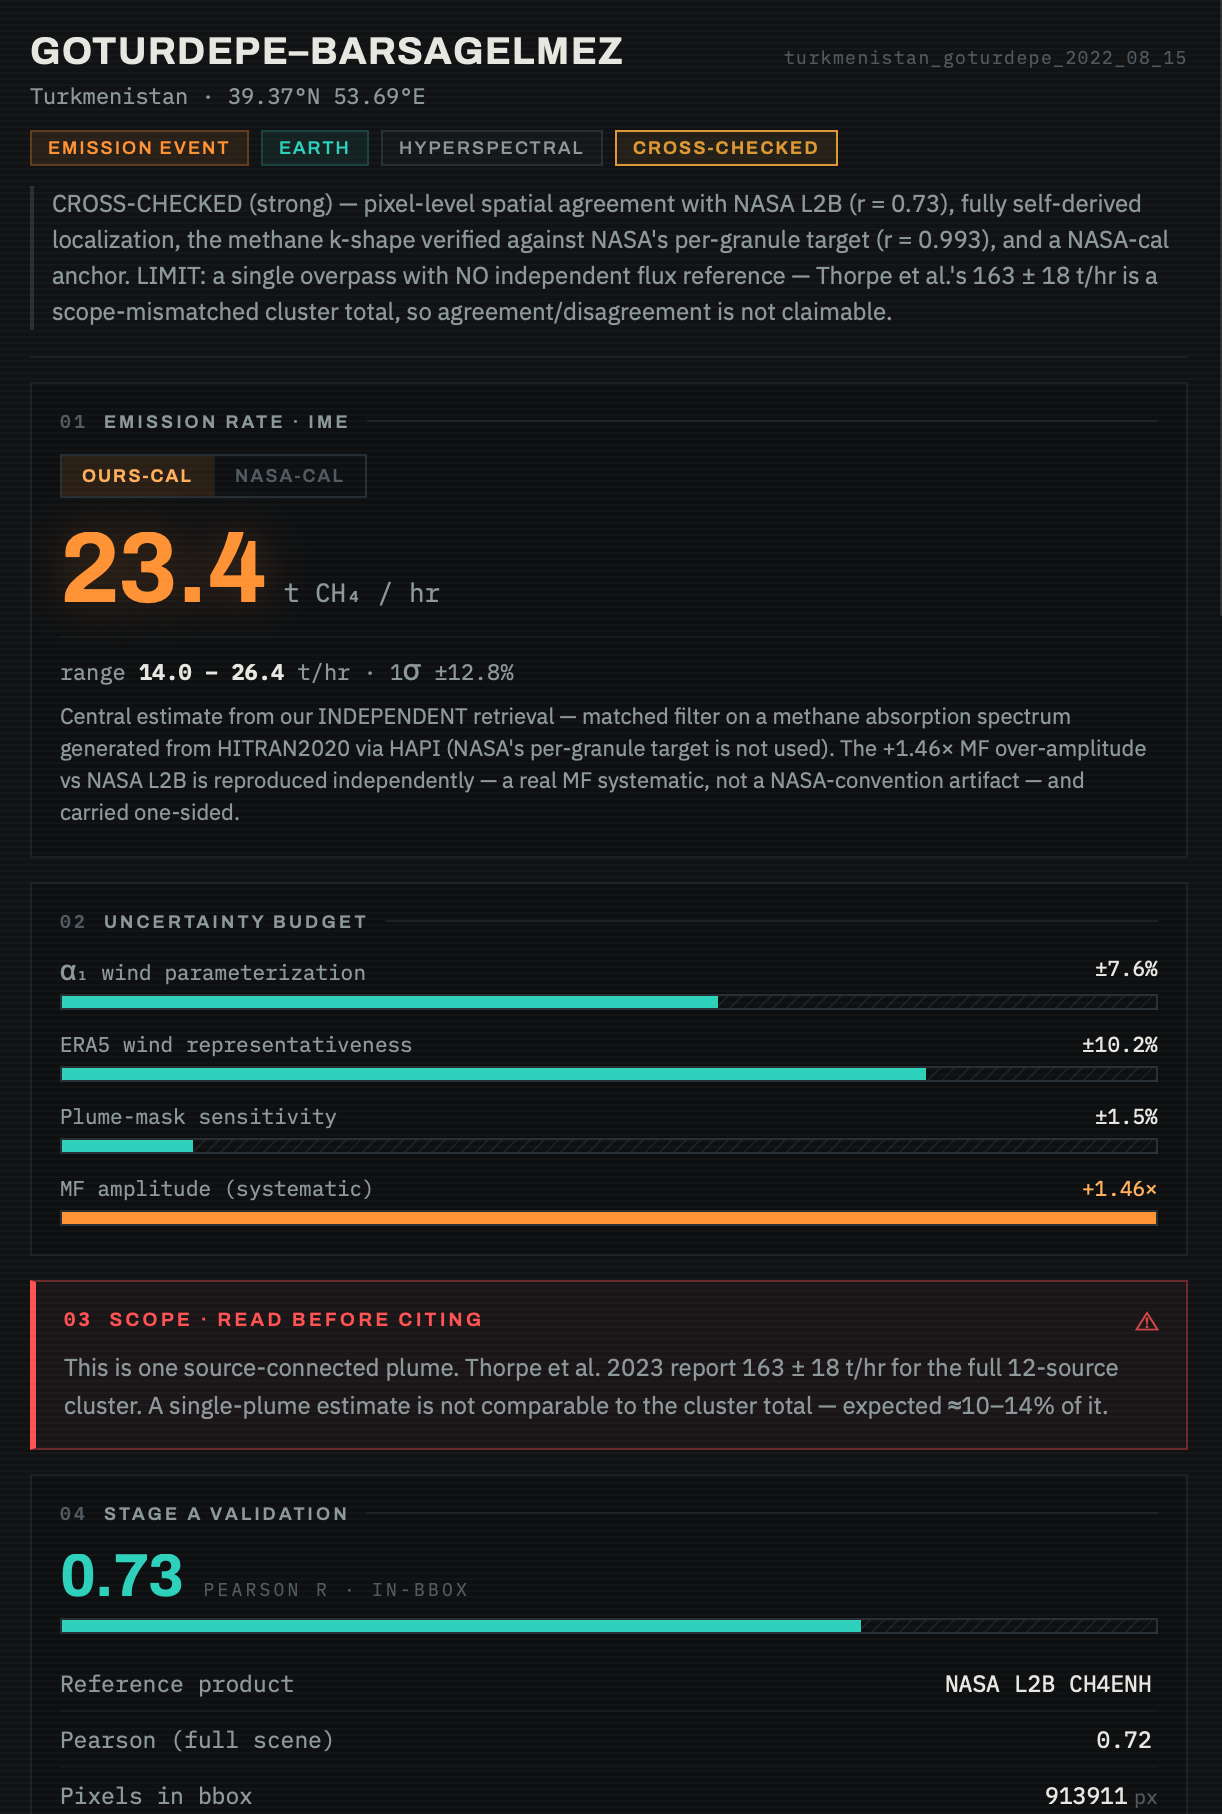
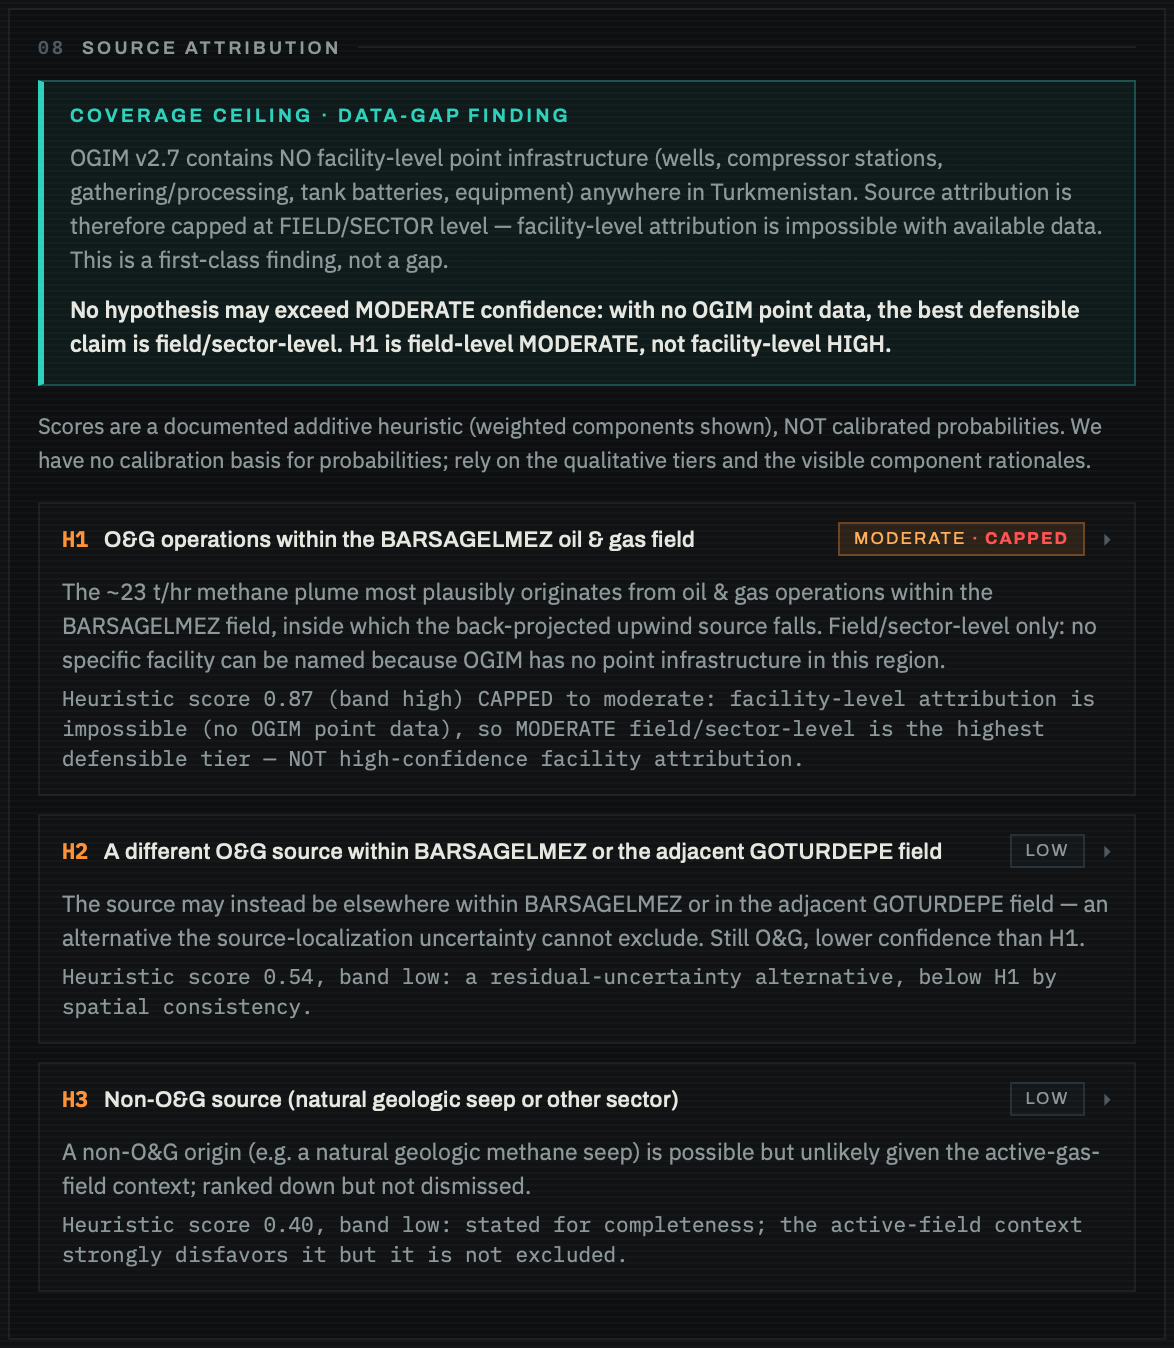
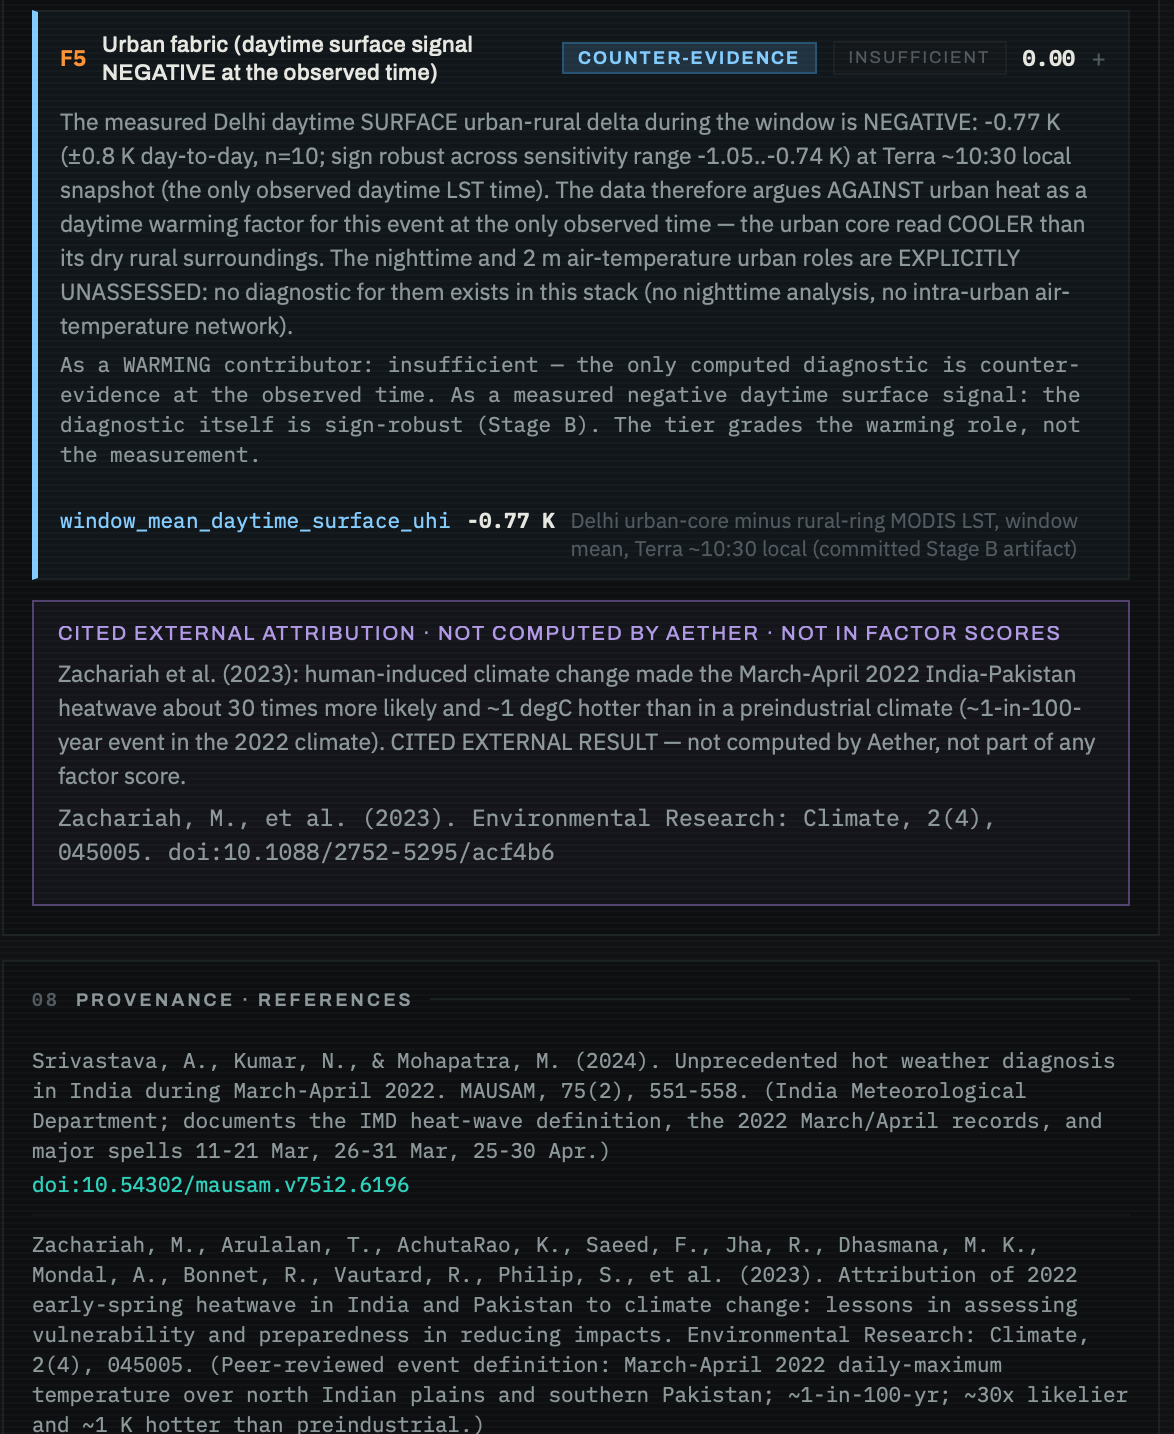
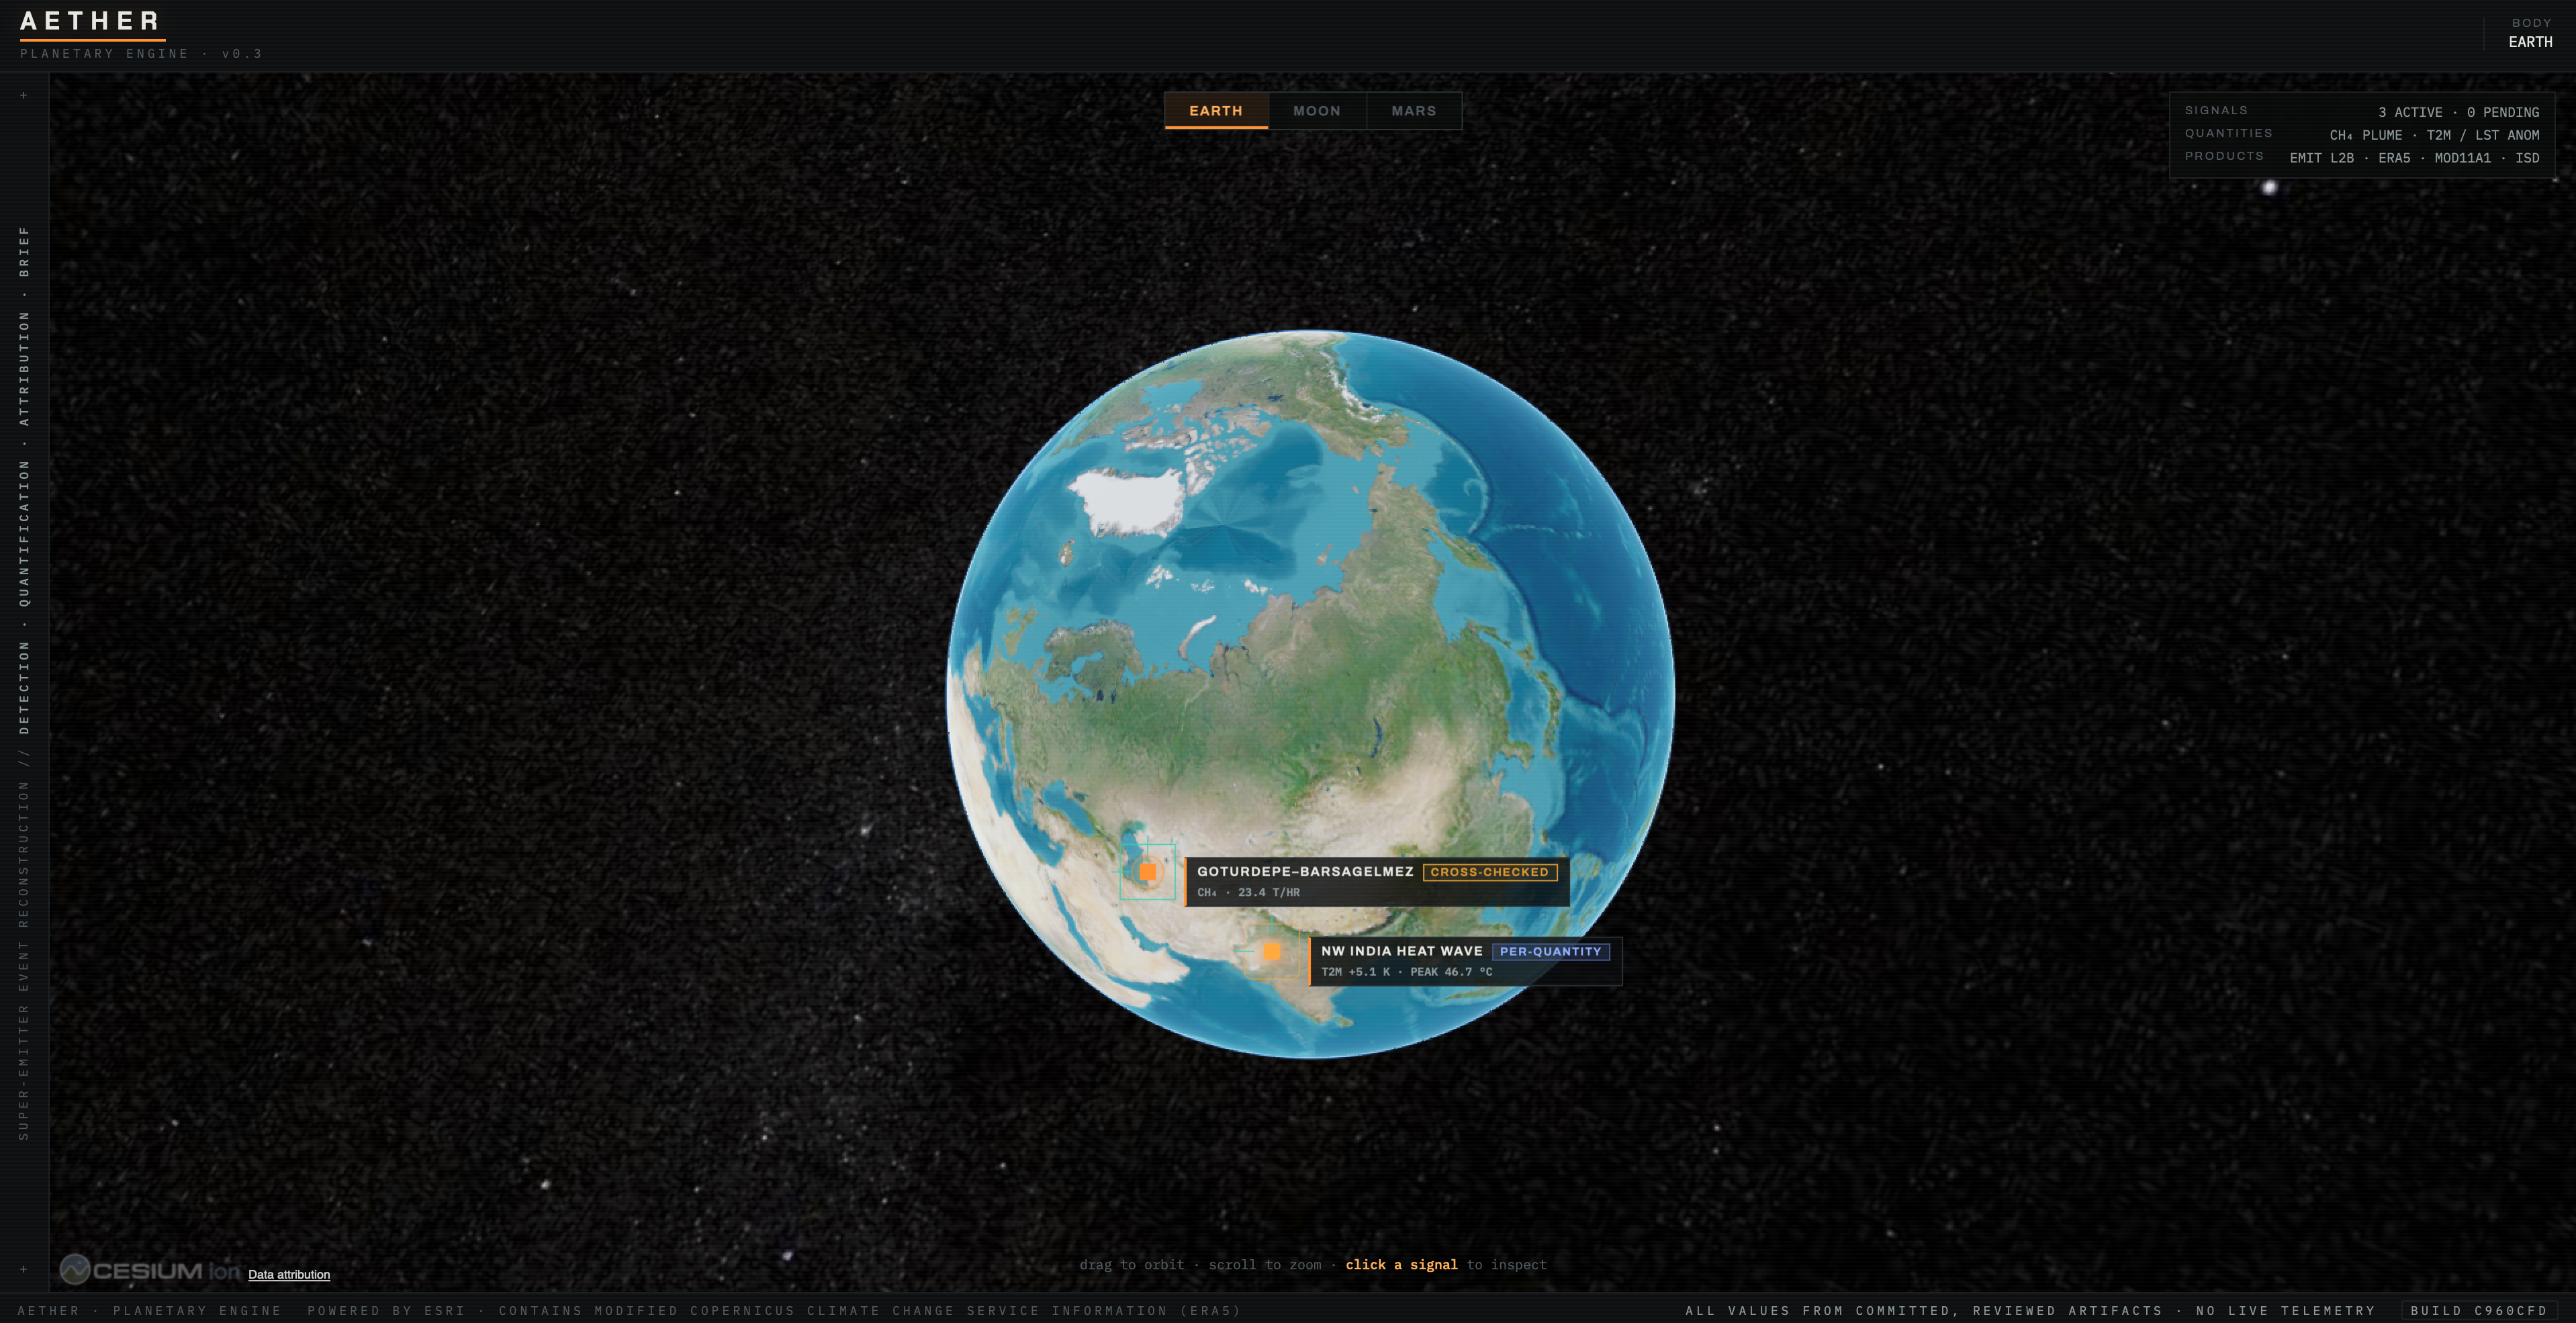
Aether is a working Earth-observation dashboard that detects and quantifies methane super-emitter plumes and reconstructs heat-wave events — and every number it shows traces back to a committed data artifact, with the scientific caveats carried all the way to the screen. It runs on public satellite data, it is live, and the part worth judging is not that it produces numbers but that it refuses to produce ones it cannot defend. (A.P.E. is the acronym; the work is an Earth methane-and-heat monitoring engine.)

DomainMethane + Heat
EventsThree
DataPublic EO
StatusLive demo
The Problem.01

Methane super-emitters and extreme heat are both quantification problems with a trust problem attached. A satellite sees a faint plume or a hot anomaly; turning that into a defensible number — a flux in tonnes per hour, a temperature anomaly in kelvin — means a chain of retrieval, calibration, wind, and baseline choices, each carrying uncertainty. The characteristic failure in this field is not the missing number, it is the over-confident one. Aether is built so a reader can follow any number on the screen back to the artifact and the assumption it came from, and so the dashboard says “cross-checked, not validated” where that is the honest ceiling.

What Was Built.02

Three real events across two phenomenon domains, end to end. Methane: two EMIT overpasses — the Goturdepe (Turkmenistan) and Permian (Carlsbad, NM) oil-and-gas plumes — detected with a per-column matched filter, quantified by integrated mass enhancement, and attributed against an open oil-and-gas infrastructure database. The matched-filter target spectrum is generated independently from HITRAN2020 line-by-line data; NASA's per-granule file is never read, and is kept only as a spectral-shape cross-check (r 0.993). Heat: the March–April 2022 northwest-India heat wave, with a 2 m air-temperature lane validated against ground stations and a separate land-surface-temperature lane that is never conflated with it. The pipeline runs on public data (EMIT, ERA5, MODIS); the dashboard serves committed artifacts only — no runtime fetching — and renders the results, and their caveats, verbatim.

The dashboard's three-event globe — Goturdepe, Permian, and the NW-India heat wave
The Rigor.03

The validation tier is earned by evidence, never asserted, and the failures ship next to the successes. For the India heat wave the pass/fail criteria were committed before the station data was read: the peak 2 m temperature (46.68 °C) and the regional anomaly (+5.67 K) passed against ground stations and the independent IMD product, and are tier VALIDATED — but the event's duration and extent FAILED their pre-registered criteria across two station datasets, and that criterion-edge fragility is reported as a finding, not hidden.

The methane flux is CROSS-CHECKED, not VALIDATED: it agrees spatially and in integrated mass with NASA's independent product, but absolute accuracy is unproven — and a +1.46× matched-filter amplitude systematic is reported and left uncorrected, because correcting it would forfeit the retrieval's independence, and it does not even transfer to the second scene. The Delhi daytime urban heat-island result is negative (−0.77 K — an urban cool island), carried as counter-evidence to the obvious prior. Event-level VALIDATED is deliberately held by no event. And the live demo proves this about itself: a committed verifier checks that the deployed service serves byte-identical committed results at the git commit it reports, and that non-redistributable raw data is provably absent — the dashboard cannot quietly drift from the repository.

The per-quantity validation table — C1/C2 VALIDATED, C3/C4 failed with their criteria attached
Two Lanes, Never Conflated.04

Heat is reported in two physically distinct lanes the dashboard never merges: a 2 m air-temperature lane (validated against ground stations and the independent IMD product) and a land-surface (skin) temperature lane (capped at cross-checked — a late-morning Terra snapshot, never a daily maximum). Keeping them apart is the point: a reader cannot mistake a hot skin reading for an air-temperature claim, and the inspector shows the air-temperature lane before any land-surface number.

The two-lanes heat block — 2 m air temperature shown separately from land-surface temperature
Factor Attribution & Its Boundary.05

The heat wave's contributing factors are ranked from computed reanalysis diagnostics — presence and rarity, not a quantified causal share. The panel shows the synoptic ridge ranked first but capped, the popular dry-soil and urban priors argued against by the data, the negative daytime urban heat-island carried as explicit counter-evidence, and the published climate-change attribution result kept outside the engine's own scores as cited external evidence — never blended in.

The factor-attribution panel — ranked ridge, counter-evidence, and the cited-external attribution boundary
The Numbers.06
ResultFigureTier / note
Goturdepe methane flux (EMIT 2022-08-15)23.4 t/hrCross-checked (strong) — 16.0 t/hr NASA-anchored; ±12.8%
Goturdepe spatial agreement vs NASA L2Br = 0.731independent retrieval; k-shape vs NASA r = 0.993
Matched-filter amplitude systematic1.46×reproduced, left uncorrected; does not transfer
Permian methane flux (EMIT 2022-08-26)0.85 t/hrCross-checked (weaker) — integrated mass 0.96× vs NASA; pixel r = 0.137
NW-India peak 2 m Tmax46.68 °CValidated — pre-registered vs ISD stations
NW-India regional anomaly+5.67 KValidated — pre-registered vs IMD (independent)
NW-India duration / extent26 d / 889,700 km²Not validated — pre-registered criteria FAILED (the finding)
Delhi daytime surface UHI−0.77 Knegative — counter-evidence to the urban-heat prior
Heat factor attribution (ridge)ranked #1, cappedpresence & rarity, not a quantified contribution

Figures as of aether 91620d5, drawn from the repository's committed key-results snippet (docs/key_results.json) — each value traces to a Stage A/B artifact, not to this page.

Lineage.07

Aether uses public EMIT data and open methods; it is complementary to and inspired by operational methane-monitoring programs such as Carbon Mapper — not affiliated with, endorsed by, or a replication of them. EMIT and the Tanager-class instruments share JPL imaging-spectrometer heritage, which is worth noting; equivalence of pipelines or products is not claimed.

Where This Is Headed.08

A short, honest roadmap — not a delivered claim. More events through the same provenance-traceable pipeline; more sensors in the existing lanes (TROPOMI for methane context, additional thermal sources for heat); and the items already logged as debt in the repository: the residual retrieval physics behind the +1.46× systematic, and an automated visual-fidelity check so an unstyled dashboard panel fails a test rather than a human eye. Each earns its way in the same manner the current work did — against committed references, with the caveats kept.

See It Live.09

This page is the case study; the working software is the live demo. They are different things — arkaneworks.co/ape is this write-up, aether.arkaneworks.co is the running dashboard — and the dashboard is where the numbers above are rendered with their full provenance and caveats.

The launch at the top of this page opens it in a new tab rather than embedding it, by design: the dashboard's API enforces a strict origin allowlist (the same hardening this case study describes), so framing it on another site would mean loosening the very guard that makes it trustworthy.

How It Was Built.10

Aether was built with AI-assisted development under a human-architected, gated workflow. A human set the architecture, the sprint scope, and the acceptance criteria, and ran the gate reviews by reading the committed artifacts; AI coding tools did the implementation. One writer touched the repository at a time, and irreversible actions — deploys, pushes, anything outward-facing — required explicit human approval.

That discipline is the point, and it is the same discipline visible in the results above: every claim is required to trace to a committed artifact, validation tiers are not inflated (the methane flux is cross-checked, not validated; the pre-registered heat criteria where duration and extent honestly failed are reported, not hidden), and a deployed-integrity guard proves the live instance serves exactly the committed artifacts. The engineering maturity on display is not that every line was hand-typed — it is that the work was architected, reviewed, and held to a fabrication-resistant standard at every gate.

References.11